Daily market news

forex Forex
07:00 - 12.05.2026
Author:

EUR/USD Price Forecast: Falls toward 1.1750 near nine-day EMA

EUR/USD extends its losses for the second successive day, trading around 1.1760 during the Asian hours on Tuesday. The daily chart technical analysis indicates an ongoing bullish bias as the pair is remaining within the ascending channel pattern.

commodities Commodities
06:00 - 12.05.2026
Author:

Silver Price Forecast: XAG/USD trades firmly near two-month high of $86.50 ahead of US CPI

Silver price (XAG/USD) holds onto its almost week-long rally to near $86.50 during the Asian trading session on Tuesday. The white metal trades firmly even as oil prices are broadly stable amid fears that military actions between the United States (US) and Iran could resume.

forex Forex
04:00 - 12.05.2026
Author:

AUD/USD Price Forecast: Eyes nine-day EMA support near 0.7200

AUD/USD loses ground after two days of gains, trading around 0.7240 during the Asian hours on Tuesday. The technical analysis of the daily chart indicates that the pair is moving upwards within the ascending channel, suggesting an ongoing bullish bias.

commodities Commodities
03:00 - 12.05.2026
Author:
kelvin_wong
Kelvin Wong

Asia open: Stocks hit new highs on AI optimism as US-Iran ceasefire hangs by a thread

Global stocks surged to new record highs as AI optimism continued to dominate market sentiment despite escalating concerns over the fragile US-Iran ceasefire. The Nasdaq 100, S&P 500, Nikkei 225, and KOSPI extended gains while semiconductor shares and AI infrastructure themes remained key drivers. Meanwhile, rising oil prices and stronger inflation expectations lifted Treasury yields and reinforced a hawkish Federal Reserve outlook ahead of the crucial US CPI report.

commodities Commodities
21:46 - 11.05.2026
Author:
Elior Manier

Silver (XAG/USD) is in breakout mode, pushing above $85 – In-depth Silver technical analysis

Silver (XAG/USD) update: The Grey metal officially enters a major breakout phase, surging 7% to clear the $85 handle. Decoupling from Gold's typical lead and fueled by signs of an industrial recovery in China, Silver is reclaiming its role as a high-demand industrial asset. Explore our in-depth technical analysis for XAG/USD.

indices Indices
18:31 - 11.05.2026
Author:
Elior Manier

Tech does not wait on CPI and Geopolitics – Dow Jones, Nasdaq and S&P 500 CPI Levels

S&P 500, Dow Jones, Nasdaq Analysis and Trading Levels: US stock benchmarks settle into a cautious range as markets brace for tomorrow's high-stakes CPI report. Despite a weekend diplomatic stalemate between the US and Iran and steadily rising oil prices, the "China Summit" optimism continues to bolster the Nasdaq and S&P 500. Explore our pre-CPI technical analysis of the major indexes.

18:00 - 11.05.2026
Author:

WTI Oil climbs on Trump rejection of Iran peace plan, Hormuz closure fears

West Texas Intermediate (WTI) Oil posts strong gains on Monday, with the US benchmark trading around $94.70 at the time of writing, up 3.18% on the day after opening the week with a significant bullish gap.

forex Forex
16:00 - 11.05.2026
Author:

GBP/USD Price Forecast: Buyers retain control above 200-day SMA

GBP/USD recovers some ground after opening the week with a bearish gap as geopolitical headlines surrounding the Middle East continue to stir volatility across financial markets.

commodities Commodities
13:00 - 11.05.2026
Author:

Gold Price Forecast: XAU/USD hits lows near $4,650 as Fed easing hopes dim

Gold (XAU/USD) pulls back from last week’s high on Monday, reaching session lows a few dollars above the $4,650 level at the time of writing.

forex Forex
12:00 - 11.05.2026
Author:

British Pound recovers further vs USD; GBP/USD holds near daily peak, above 1.3600

The GBP/USD pair fills a major part of its weekly bearish gap opening on Monday and is now looking to extend the momentum further beyond the 1.3600 mark.

OANDA's pick for the day

22:39 - 07.05.2026
Is the party over already? – North American Session Market Wrap for May 7
22:29 - 06.05.2026
The Peace rally can't be stopped – North American Session Market Wrap for May 6
22:11 - 04.05.2026
Sentiment waves are on a shore-break – North American Session Market Wrap for May 4
22:03 - 30.04.2026
It's an all-out rally after the Central Bank holds – North American Session Market Wrap for April 30
17:00 - 19.02.2026
17:00 - 19.02.2026

WTI climbs to six-month high on rising US-Iran tensions

WTI extends gains after a nearly 5% rally, hitting its highest level since August 2025.Escalating US-Iran tensions lift geopolitical risk premium in Oil markets.Technical structure improves as RSI holds above 50.

West Texas Intermediate (WTI) extends its advance on Thursday following a nearly 4.9% rally a day earlier, as mounting US-Iran tensions fuel concerns over potential supply disruptions in the Middle East. At the time of writing, the US benchmark trades around $66.38 per barrel, hitting its highest level since August 2025.

Markets are pricing in elevated geopolitical risk following reports of potential US military action after nuclear negotiations with Iran failed to yield a breakthrough earlier this week. Any escalation could threaten crude flows through the Strait of Hormuz, a strategic chokepoint that handles roughly 20% of global Oil shipments.

US President Donald Trump said earlier in the day that “good talks are being had with Iran,” adding that Washington must secure a “meaningful deal.” He stressed that “they can’t have a nuclear weapon” and noted that “we will find out about Iran in about 10 days.

Meanwhile, The Times reported that the United Kingdom (UK) is blocking the US from using Royal Air Force (RAF) bases for potential strikes on Iran, adding another layer of geopolitical uncertainty to the situation.

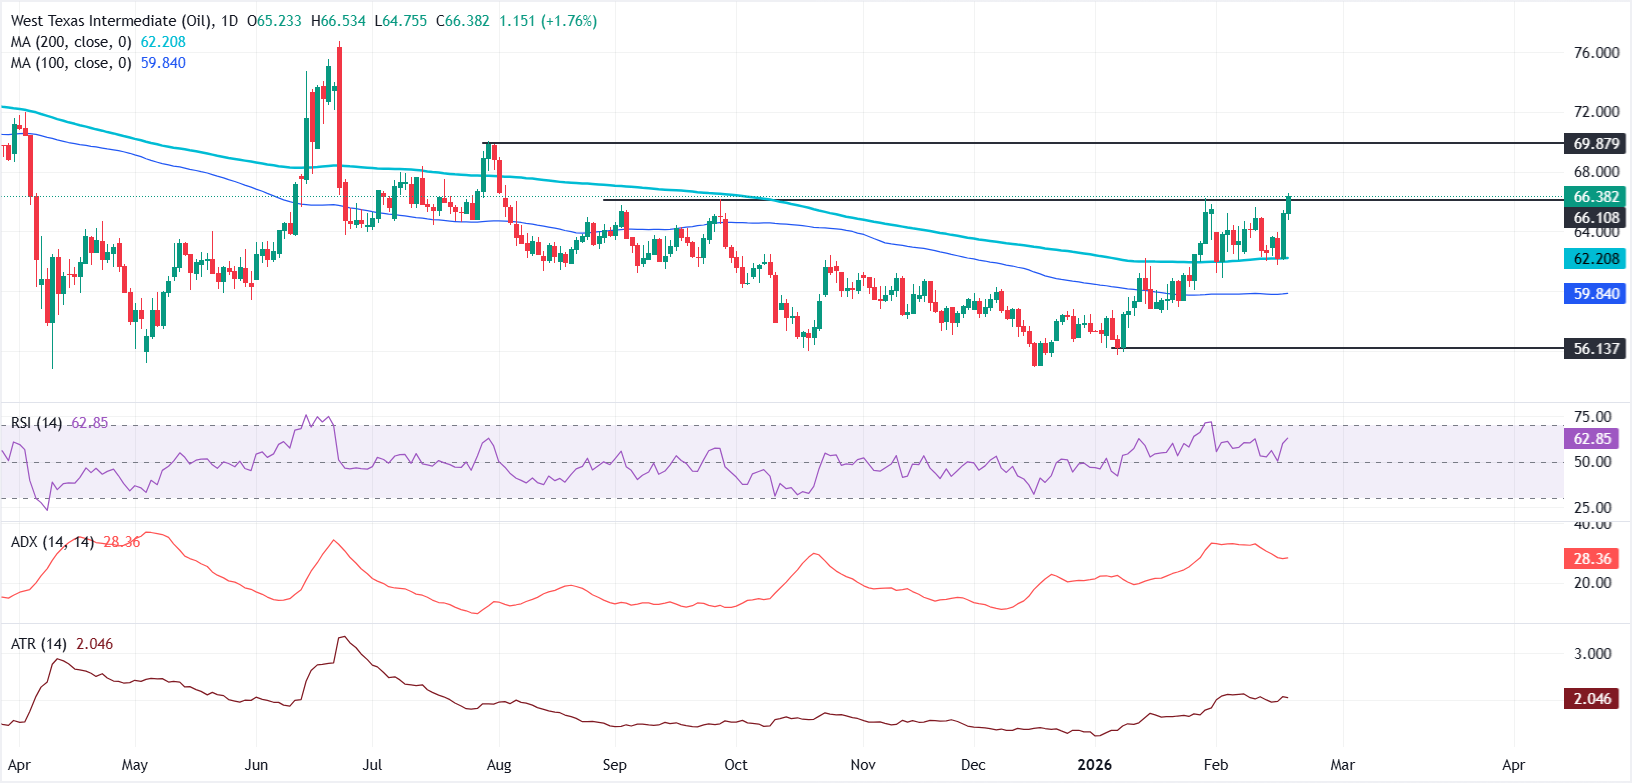
From a technical perspective, WTI’s outlook has improved on the daily chart after prices climbed back above key moving averages, including the 200-day Simple Moving Average (SMA) near $62.20, which now acts as dynamic support following repeated rebounds.

Price action is forming a sequence of higher highs and higher lows, suggesting buyers remain firmly in control. Momentum indicators support the bullish tilt.

The Relative Strength Index (RSI) holds near 63, comfortably above the neutral 50 mark, indicating sustained upside momentum without yet entering overbought territory. Meanwhile, the Average Directional Index (ADX) around 28 signals strengthening trend conditions, with the Average True Range at 2.05 pointing to contained volatility.

On the upside, prices are currently testing a key resistance zone in the $66.00-$67.00 region. A sustained break above this barrier could open the door toward the next upside target near $70.00.

Conversely, a break below the 200-day SMA would weaken the bullish structure, exposing the 100-day SMA near $59.83 as the next support, followed by the $56.00 area.

WTI Oil FAQs
What is WTI Oil?

WTI Oil is a type of Crude Oil sold on international markets. The WTI stands for West Texas Intermediate, one of three major types including Brent and Dubai Crude. WTI is also referred to as “light” and “sweet” because of its relatively low gravity and sulfur content respectively. It is considered a high quality Oil that is easily refined. It is sourced in the United States and distributed via the Cushing hub, which is considered “The Pipeline Crossroads of the World”. It is a benchmark for the Oil market and WTI price is frequently quoted in the media.

What factors drive the price of WTI Oil?

Like all assets, supply and demand are the key drivers of WTI Oil price. As such, global growth can be a driver of increased demand and vice versa for weak global growth. Political instability, wars, and sanctions can disrupt supply and impact prices. The decisions of OPEC, a group of major Oil-producing countries, is another key driver of price. The value of the US Dollar influences the price of WTI Crude Oil, since Oil is predominantly traded in US Dollars, thus a weaker US Dollar can make Oil more affordable and vice versa.

How does inventory data impact the price of WTI Oil

The weekly Oil inventory reports published by the American Petroleum Institute (API) and the Energy Information Agency (EIA) impact the price of WTI Oil. Changes in inventories reflect fluctuating supply and demand. If the data shows a drop in inventories it can indicate increased demand, pushing up Oil price. Higher inventories can reflect increased supply, pushing down prices. API’s report is published every Tuesday and EIA’s the day after. Their results are usually similar, falling within 1% of each other 75% of the time. The EIA data is considered more reliable, since it is a government agency.

How does OPEC influence the price of WTI Oil?

OPEC (Organization of the Petroleum Exporting Countries) is a group of 12 Oil-producing nations who collectively decide production quotas for member countries at twice-yearly meetings. Their decisions often impact WTI Oil prices. When OPEC decides to lower quotas, it can tighten supply, pushing up Oil prices. When OPEC increases production, it has the opposite effect. OPEC+ refers to an expanded group that includes ten extra non-OPEC members, the most notable of which is Russia.

This publication has been prepared by OANDA TMS Brokers S.A. with its registered office in Warsaw, Warsaw UNIT, Daszyńskiego 1, 00-843 Warsaw, registered by the District Court for the Capital City of Warsaw in Warsaw, XIII Commercial Division of the National Court Register under KRS number 0000204776, NIP number 5262759131, with a share capital amounting to PLN 3,537.560, fully paid up, operating in accordance with the Act on Trading in Financial Instruments dated July 29th 2005, exclusively for the needs of OANDA TMS Brokers' clients. OANDA TMS Brokers is subject to the supervision of the Polish Financial Supervision Authority on the basis of an authorization of April 26th 2004 (KPWiG-4021-54-1/2004)

This publication is a commercial publication within the meaning of art. 36 par. 2 of Commission Delegated Regulation (EU) 2017/565 of 25 April 2016 supplementing Directive 2014/65 / EU of the European Parliament and of the Council with regard to the organizational requirements and operating conditions of investment firms and the concepts defined for the purposes of this directive.

Recipients of this publication should consult the financial adviser before taking any investment decision on the basis of this publication.

In the preparation of this document OANDA TMS Brokers not take into account the individual needs and situation of the investor. Investments and services presented or included in this document may not be suitable for a specific investor, therefore, in case of doubts concerning such investments or investment services, it is recommended to consult an independent investment advisor.

Recipients of this report must make their own determination of the appropriateness of an investment in any financial instruments referred to herein based on the merits and risks involved, their own investment strategy and their legal and financial position.

None of the information presented in this publication constitutes investment, legal, accounting or tax advice or a statement that any investment strategy is adequate or appropriate due to individual circumstances related to the recipient, as well as does not constitute any other personal recommendation. OANDA TMS Brokers does not provide tax advisory services related to investing in financial instruments and recommends to contact an independent tax advisor.

OANDA TMS Brokers informs that in the case of a general recommendation service, there is a conflict of interest consisting in the issuance by OANDA TMS Brokers recommendation of a general nature, while OANDA TMS Brokers concluded transactions on the trading portfolio.

This publication is only informative and:

(i) does not constitute or form part of a sale, subscription or invitation to subscribe for any financial instruments,

(ii) it is not intended to offer or purchase or subscribe to or acquire any financial instruments

(iii) does not constitute advertising of any financial instruments

This publication has been prepared with due diligence, reliability and principles of objectivity based on generally available information. The information and opinions contained in this document have been collected or developed by OANDA TMS Brokers based on sources considered reliable, however OANDA TMS Brokers and related entities are not responsible for any inaccuracies or omissions. This document expresses the knowledge and views of its authors, as at the date of preparation.

The results achieved in the past should not be treated as an indication of whether the guarantee of future results. OANDA TMS Brokers is not responsible for investment decisions taken on the basis of this publication or for damages incurred as a result of investment decisions based on this publication.

The date on the first page of this publication is the date of its preparation and publication.

The Stocks service variant is offered in cross-selling together with the CFDs service variant. Detailed information on the risks arising from the various services being part of the cross-selling, as well as information on the costs and fees associated with these services, is available at OANDA TMS Brokers website in the Documents section.

CFDs are complex instruments and involve a high risk of a quick loss of cash due to leverage. 76% of retail investors' accounts record losses as a result of trading CFDs at this supplier. Consider if you understand how CFDs work and whether you can afford a high risk of losing money.

Detailed information about OANDA TMS Brokers, principles of preparing and disseminating recommendations, sources of information, determining recipients of recommendations, professional terminology, conflicts of interest, as well as frequency of issuing and validity of recommendations, are available at www.tmsbrokers.com in the section https://www.tmsbrokers.com/disclaimer

Scroll to top