Daily market news

forex Forex
07:00 - 12.05.2026
Author:

EUR/USD Price Forecast: Falls toward 1.1750 near nine-day EMA

EUR/USD extends its losses for the second successive day, trading around 1.1760 during the Asian hours on Tuesday. The daily chart technical analysis indicates an ongoing bullish bias as the pair is remaining within the ascending channel pattern.

commodities Commodities
06:00 - 12.05.2026
Author:

Silver Price Forecast: XAG/USD trades firmly near two-month high of $86.50 ahead of US CPI

Silver price (XAG/USD) holds onto its almost week-long rally to near $86.50 during the Asian trading session on Tuesday. The white metal trades firmly even as oil prices are broadly stable amid fears that military actions between the United States (US) and Iran could resume.

forex Forex
04:00 - 12.05.2026
Author:

AUD/USD Price Forecast: Eyes nine-day EMA support near 0.7200

AUD/USD loses ground after two days of gains, trading around 0.7240 during the Asian hours on Tuesday. The technical analysis of the daily chart indicates that the pair is moving upwards within the ascending channel, suggesting an ongoing bullish bias.

commodities Commodities
03:00 - 12.05.2026
Author:
kelvin_wong
Kelvin Wong

Asia open: Stocks hit new highs on AI optimism as US-Iran ceasefire hangs by a thread

Global stocks surged to new record highs as AI optimism continued to dominate market sentiment despite escalating concerns over the fragile US-Iran ceasefire. The Nasdaq 100, S&P 500, Nikkei 225, and KOSPI extended gains while semiconductor shares and AI infrastructure themes remained key drivers. Meanwhile, rising oil prices and stronger inflation expectations lifted Treasury yields and reinforced a hawkish Federal Reserve outlook ahead of the crucial US CPI report.

commodities Commodities
21:46 - 11.05.2026
Author:
Elior Manier

Silver (XAG/USD) is in breakout mode, pushing above $85 – In-depth Silver technical analysis

Silver (XAG/USD) update: The Grey metal officially enters a major breakout phase, surging 7% to clear the $85 handle. Decoupling from Gold's typical lead and fueled by signs of an industrial recovery in China, Silver is reclaiming its role as a high-demand industrial asset. Explore our in-depth technical analysis for XAG/USD.

indices Indices
18:31 - 11.05.2026
Author:
Elior Manier

Tech does not wait on CPI and Geopolitics – Dow Jones, Nasdaq and S&P 500 CPI Levels

S&P 500, Dow Jones, Nasdaq Analysis and Trading Levels: US stock benchmarks settle into a cautious range as markets brace for tomorrow's high-stakes CPI report. Despite a weekend diplomatic stalemate between the US and Iran and steadily rising oil prices, the "China Summit" optimism continues to bolster the Nasdaq and S&P 500. Explore our pre-CPI technical analysis of the major indexes.

18:00 - 11.05.2026
Author:

WTI Oil climbs on Trump rejection of Iran peace plan, Hormuz closure fears

West Texas Intermediate (WTI) Oil posts strong gains on Monday, with the US benchmark trading around $94.70 at the time of writing, up 3.18% on the day after opening the week with a significant bullish gap.

forex Forex
16:00 - 11.05.2026
Author:

GBP/USD Price Forecast: Buyers retain control above 200-day SMA

GBP/USD recovers some ground after opening the week with a bearish gap as geopolitical headlines surrounding the Middle East continue to stir volatility across financial markets.

commodities Commodities
13:00 - 11.05.2026
Author:

Gold Price Forecast: XAU/USD hits lows near $4,650 as Fed easing hopes dim

Gold (XAU/USD) pulls back from last week’s high on Monday, reaching session lows a few dollars above the $4,650 level at the time of writing.

forex Forex
12:00 - 11.05.2026
Author:

British Pound recovers further vs USD; GBP/USD holds near daily peak, above 1.3600

The GBP/USD pair fills a major part of its weekly bearish gap opening on Monday and is now looking to extend the momentum further beyond the 1.3600 mark.

OANDA's pick for the day

22:39 - 07.05.2026
Is the party over already? – North American Session Market Wrap for May 7
22:29 - 06.05.2026
The Peace rally can't be stopped – North American Session Market Wrap for May 6
22:11 - 04.05.2026
Sentiment waves are on a shore-break – North American Session Market Wrap for May 4
22:03 - 30.04.2026
It's an all-out rally after the Central Bank holds – North American Session Market Wrap for April 30
forex Forex
00:00 - 20.02.2026
Forex
00:00 - 20.02.2026

NZD/USD remains trapped below 0.6000 after dovish RBNZ repricing

The New Zealand Dollar continues to face downside pressure as the RBNZ pushes back rate hike timeline, widening divergence with the hawkish Fed.The RBNZ held the OCR at 2.25% on Wednesday but shifted its projected first hike to late 2026, well behind the roughly 40 basis points of tightening markets had priced by year-end.Hawkish FOMC minutes on Wednesday reinforced the Fed's hold at 3.50% to 3.75%, with US core PCE on Friday the next test for rate cut expectations; RBNZ Governor Breman speaks again on Thursday.

The RBNZ held the OCR at 2.25% as expected on Wednesday, but Governor Breman's updated rate track triggered a sharp Kiwi sell-off after projecting the first potential hike in late 2026, much later than markets had anticipated. The OCR is now projected to reach just 3% by 2028, pointing to a very shallow tightening cycle. Consumer Price Index (CPI) inflation at 3.1% sits above the RBNZ's 1% to 3% target band, but Breman signaled confidence that it will return to 2% without urgent action. The dovish surprise widens the policy gap with the Federal Reserve (Fed), which held at 3.50% to 3.75% in January.

Wednesday's FOMC minutes reinforced a hawkish hold, with members warning that disinflation may prove "slower and more uneven" than expected. New Zealand January trade balance data on Thursday and Breman's speech later in the session provide the next near-term catalysts, with US Q4 GDP and core PCE on Friday.

Break below 0.6000 as Stochastic crosses bearish from midline

On the daily chart, NZD/USD tapped a fresh low of 0.5945 on Thursday, settling below the 0.6000 handle for the first time in over two weeks. The pair is still trading above the 50-day EMA at 0.5905 and well above the 200-day EMA at 0.5875, so the broader uptrend from the January lows near 0.5711 is continuing. However, the sharp reversal from the year-to-date high at 0.6094 has broken the consolidation range that had held since late January.

The Stochastic Oscillator has crossed bearish from around the midline and is now pointing lower, suggesting building downside momentum. Wednesday's RBNZ-driven sell-off produced a solid bearish candle that closed below 0.6000, a level that had acted as support throughout February. Immediate support now sits at the 50-day EMA near 0.5909, with 0.5856 (200-day EMA) below. On the upside, a reclaim of 0.6000 would be needed to stabilize, with resistance at 0.6050 and the 0.6094 high above.

NZD/USD daily chart


New Zealand Dollar FAQs
What key factors drive the New Zealand Dollar?

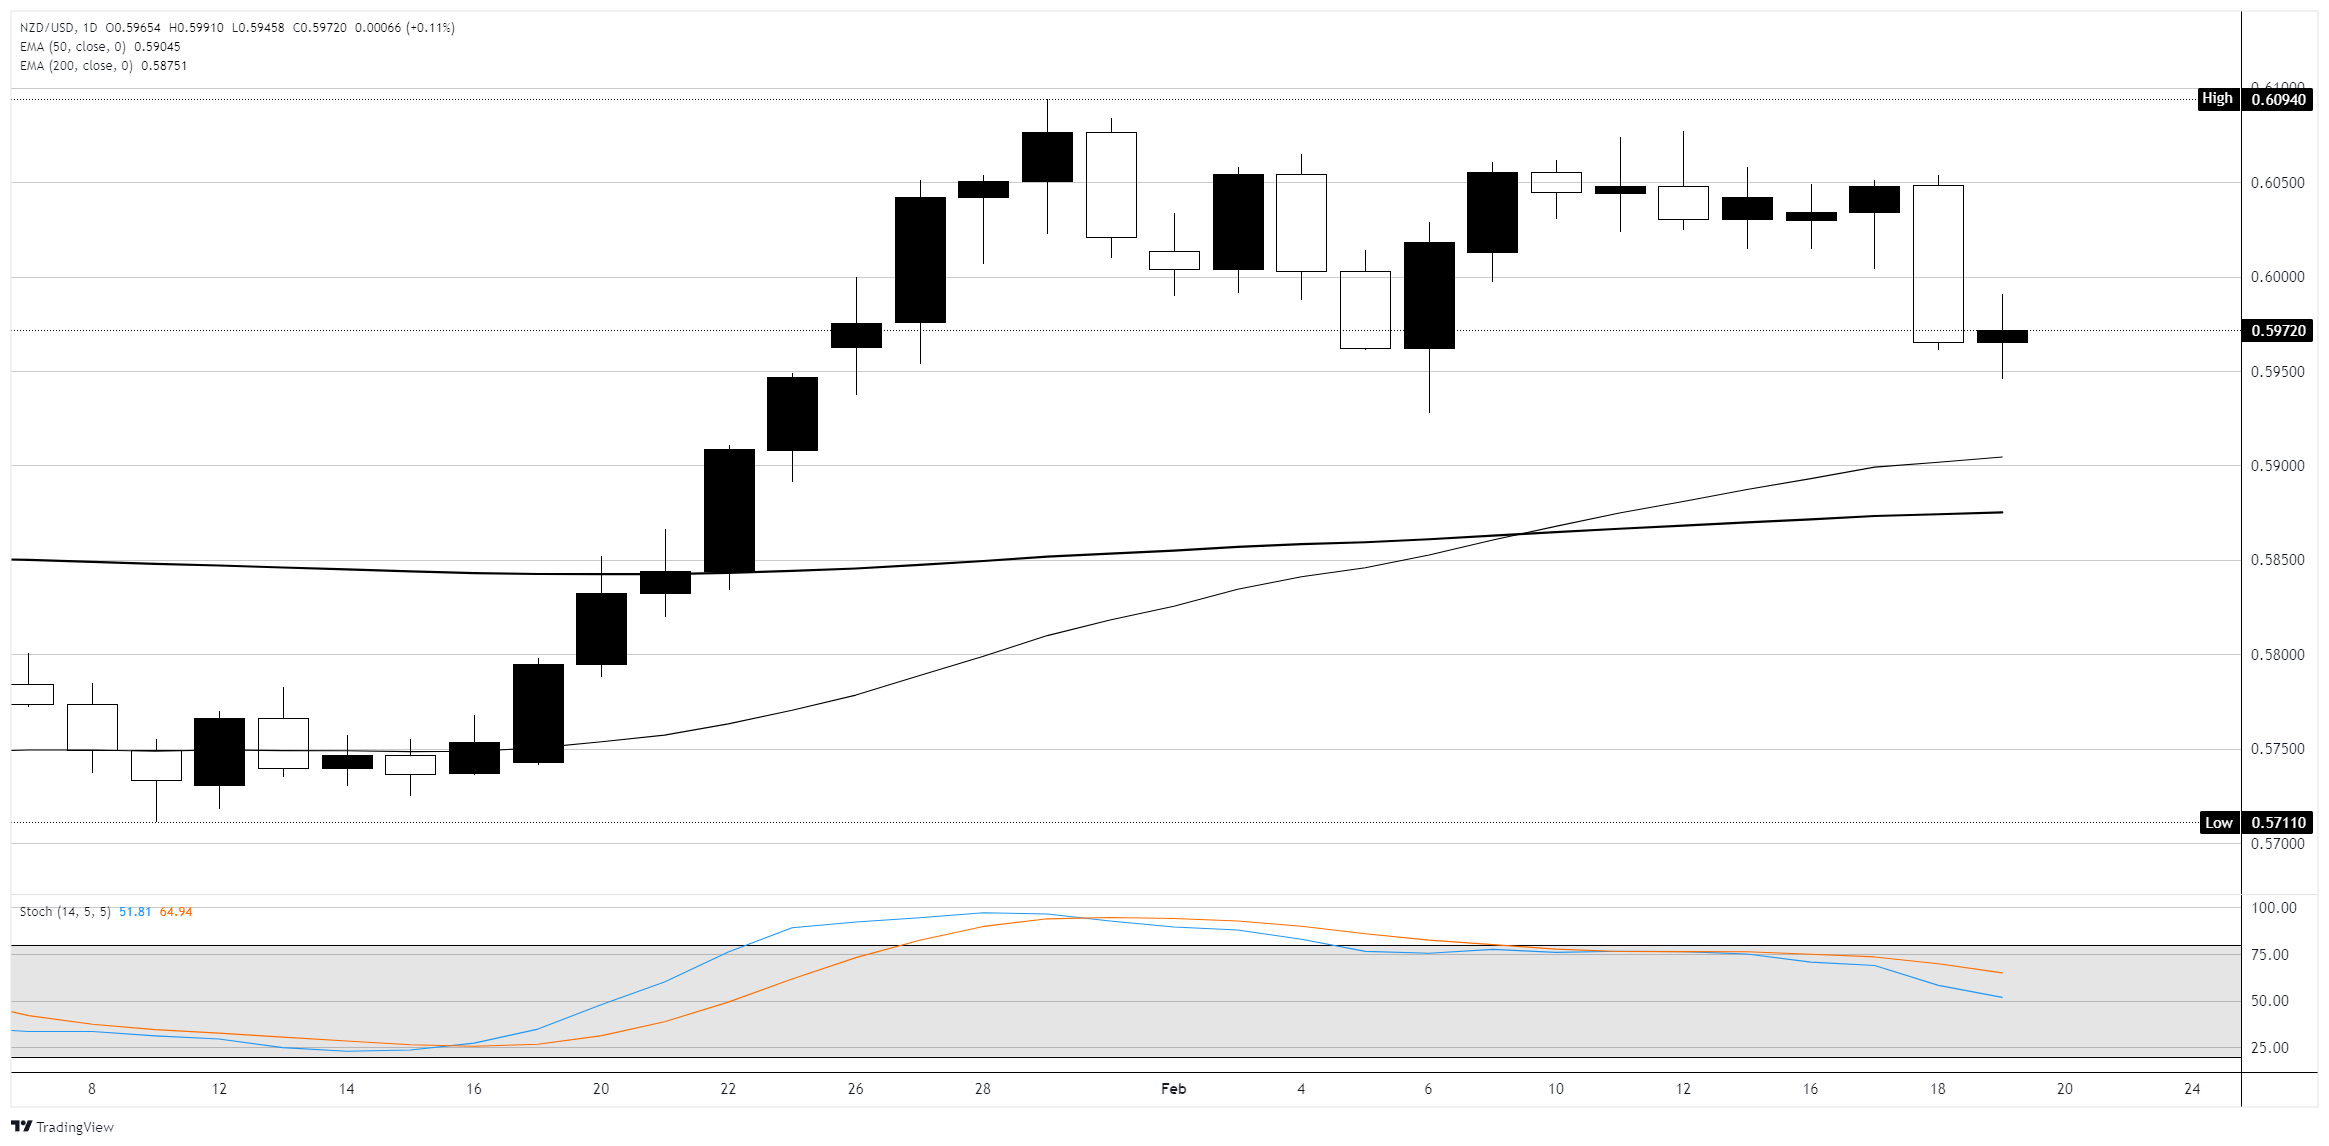
The New Zealand Dollar (NZD), also known as the Kiwi, is a well-known traded currency among investors. Its value is broadly determined by the health of the New Zealand economy and the country’s central bank policy. Still, there are some unique particularities that also can make NZD move. The performance of the Chinese economy tends to move the Kiwi because China is New Zealand’s biggest trading partner. Bad news for the Chinese economy likely means less New Zealand exports to the country, hitting the economy and thus its currency. Another factor moving NZD is dairy prices as the dairy industry is New Zealand’s main export. High dairy prices boost export income, contributing positively to the economy and thus to the NZD.

How do decisions of the RBNZ impact the New Zealand Dollar?

The Reserve Bank of New Zealand (RBNZ) aims to achieve and maintain an inflation rate between 1% and 3% over the medium term, with a focus to keep it near the 2% mid-point. To this end, the bank sets an appropriate level of interest rates. When inflation is too high, the RBNZ will increase interest rates to cool the economy, but the move will also make bond yields higher, increasing investors’ appeal to invest in the country and thus boosting NZD. On the contrary, lower interest rates tend to weaken NZD. The so-called rate differential, or how rates in New Zealand are or are expected to be compared to the ones set by the US Federal Reserve, can also play a key role in moving the NZD/USD pair.

How does economic data influence the value of the New Zealand Dollar?

Macroeconomic data releases in New Zealand are key to assess the state of the economy and can impact the New Zealand Dollar’s (NZD) valuation. A strong economy, based on high economic growth, low unemployment and high confidence is good for NZD. High economic growth attracts foreign investment and may encourage the Reserve Bank of New Zealand to increase interest rates, if this economic strength comes together with elevated inflation. Conversely, if economic data is weak, NZD is likely to depreciate.

How does broader risk sentiment impact the New Zealand Dollar?

The New Zealand Dollar (NZD) tends to strengthen during risk-on periods, or when investors perceive that broader market risks are low and are optimistic about growth. This tends to lead to a more favorable outlook for commodities and so-called ‘commodity currencies’ such as the Kiwi. Conversely, NZD tends to weaken at times of market turbulence or economic uncertainty as investors tend to sell higher-risk assets and flee to the more-stable safe havens.

This publication has been prepared by OANDA TMS Brokers S.A. with its registered office in Warsaw, Warsaw UNIT, Daszyńskiego 1, 00-843 Warsaw, registered by the District Court for the Capital City of Warsaw in Warsaw, XIII Commercial Division of the National Court Register under KRS number 0000204776, NIP number 5262759131, with a share capital amounting to PLN 3,537.560, fully paid up, operating in accordance with the Act on Trading in Financial Instruments dated July 29th 2005, exclusively for the needs of OANDA TMS Brokers' clients. OANDA TMS Brokers is subject to the supervision of the Polish Financial Supervision Authority on the basis of an authorization of April 26th 2004 (KPWiG-4021-54-1/2004)

This publication is a commercial publication within the meaning of art. 36 par. 2 of Commission Delegated Regulation (EU) 2017/565 of 25 April 2016 supplementing Directive 2014/65 / EU of the European Parliament and of the Council with regard to the organizational requirements and operating conditions of investment firms and the concepts defined for the purposes of this directive.

Recipients of this publication should consult the financial adviser before taking any investment decision on the basis of this publication.

In the preparation of this document OANDA TMS Brokers not take into account the individual needs and situation of the investor. Investments and services presented or included in this document may not be suitable for a specific investor, therefore, in case of doubts concerning such investments or investment services, it is recommended to consult an independent investment advisor.

Recipients of this report must make their own determination of the appropriateness of an investment in any financial instruments referred to herein based on the merits and risks involved, their own investment strategy and their legal and financial position.

None of the information presented in this publication constitutes investment, legal, accounting or tax advice or a statement that any investment strategy is adequate or appropriate due to individual circumstances related to the recipient, as well as does not constitute any other personal recommendation. OANDA TMS Brokers does not provide tax advisory services related to investing in financial instruments and recommends to contact an independent tax advisor.

OANDA TMS Brokers informs that in the case of a general recommendation service, there is a conflict of interest consisting in the issuance by OANDA TMS Brokers recommendation of a general nature, while OANDA TMS Brokers concluded transactions on the trading portfolio.

This publication is only informative and:

(i) does not constitute or form part of a sale, subscription or invitation to subscribe for any financial instruments,

(ii) it is not intended to offer or purchase or subscribe to or acquire any financial instruments

(iii) does not constitute advertising of any financial instruments

This publication has been prepared with due diligence, reliability and principles of objectivity based on generally available information. The information and opinions contained in this document have been collected or developed by OANDA TMS Brokers based on sources considered reliable, however OANDA TMS Brokers and related entities are not responsible for any inaccuracies or omissions. This document expresses the knowledge and views of its authors, as at the date of preparation.

The results achieved in the past should not be treated as an indication of whether the guarantee of future results. OANDA TMS Brokers is not responsible for investment decisions taken on the basis of this publication or for damages incurred as a result of investment decisions based on this publication.

The date on the first page of this publication is the date of its preparation and publication.

The Stocks service variant is offered in cross-selling together with the CFDs service variant. Detailed information on the risks arising from the various services being part of the cross-selling, as well as information on the costs and fees associated with these services, is available at OANDA TMS Brokers website in the Documents section.

CFDs are complex instruments and involve a high risk of a quick loss of cash due to leverage. 76% of retail investors' accounts record losses as a result of trading CFDs at this supplier. Consider if you understand how CFDs work and whether you can afford a high risk of losing money.

Detailed information about OANDA TMS Brokers, principles of preparing and disseminating recommendations, sources of information, determining recipients of recommendations, professional terminology, conflicts of interest, as well as frequency of issuing and validity of recommendations, are available at www.tmsbrokers.com in the section https://www.tmsbrokers.com/disclaimer

Scroll to top