Tools
Access our range of powerful analysis tools to identify potential opportunities and build a stronger trading strategy.


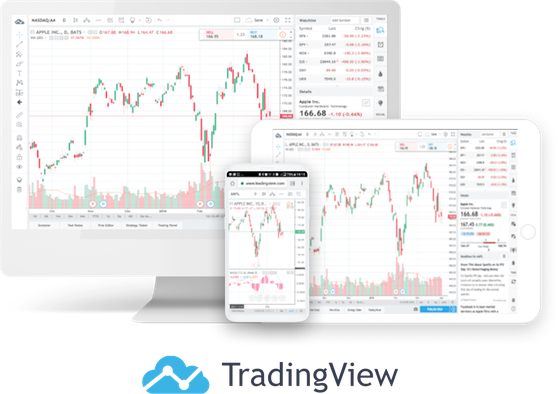
Advanced Charts - powered by TradingView
Use TradingView’s world-class advanced charting solution on our OANDA Trade platform. Leading indicators and drawing tools include trade through charts and 65+ technical indicators. Analyse market trends using drawing tools such as Pitchforks, Gann Fans, Elliott Waves and more.

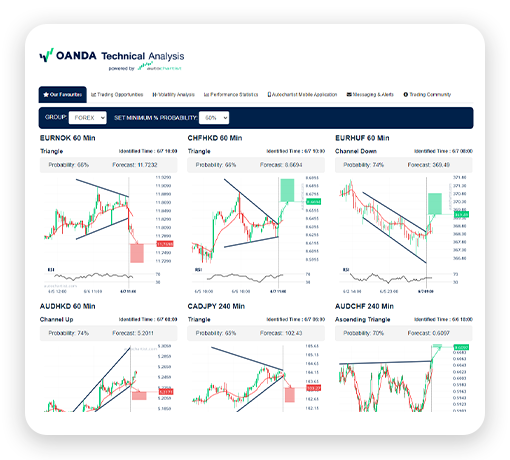
Technical analysis
Scan and analyse the intraday markets using automatic chart pattern recognition and pattern quality indicators. Technical analysis (powered by AutoChartist) is a web-based charting application accessible on our OANDA Trade platform. Continuous intraday market scanning, performance statistics, market volatility analysis and more.

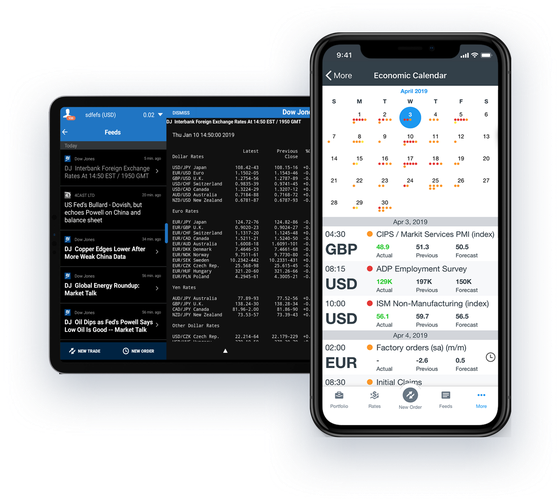
Economic overlay
Keep your finger on the trading pulse. Receive updates on important economic announcements and events directly from your OANDA Trade platform. Global economic overview, customisable view, reference results and more. Also available on OANDA Trade practice accounts.
Dow Jones FX Select
Dow Jones FX Select provides real-time breaking news, expert trend analysis, and in-depth policy commentary developed by a global team of Dow Jones business news reporters and editors. Available in a variety of languages.
Ready to start trading? Open an account in minutes
Already have a live trading account? It's easy to fund your account using one of the following payment methods.


Trade forex CFDs
Take a position on over 70 forex CFD pairs using our OANDA Trade platform and MT4 and TradingView.
3 ways to trade, plus TradingView and MetaTrader 4
Our range of platforms include OANDA Trade web, mobile and tablet, as well as TradingView and MetaTrader 4.
Take a position with OANDA Trade
OANDA Trade can be accessed from your web-browser, tablet and mobile devices.
